
Data Analytics Dashboard
Dashboard that provides key insights and identifies areas for improvement empowering strategic decision making.
Business Problem
There are multiple service providers working on a larger number of product and services. A dashboard was needed to track the key metrices and areas of improvement for product/platforms. The dashboard should include data of all suppliers.
Solution
The Data Analytics Dashboard consumes the source data from multiple sources and provides insights of key focus areas for the whole engagement tracked together for all suppliers. It caters to many products encompassing diverse suppliers.
Why is the solution unique
- One place to track all products with minimal manual effort in reporting
- Data sourced from multiple data sources and multiple vendors
- Re-usable utility, can be used in similar engagements
- Highly customizable reports
- Highlights areas for improvement
- Trend analysis for Bugs and AT-UX services.
Features/BP diagram of the solution
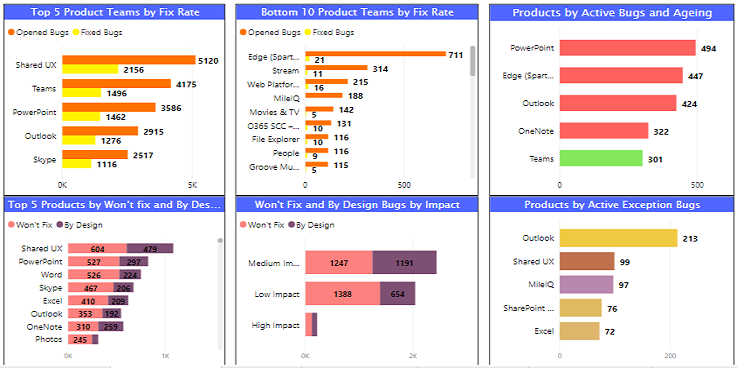
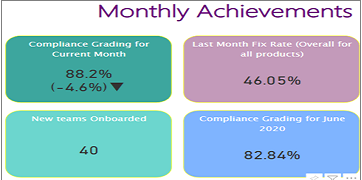
Key metrices tracked-
- Product Compliance Status and Bugs metrices
- Product accessibility health score
- Partner-Dependent Bugs tracking
- MoM data comparison
- Backlog feature tracking
It captures data through diverse sources like Azure DevOps, JIRA, GITHUB, SharePoint, Accessibility Assessment tool ServiceTree Portal

Proof Points
- Used in multiple accessibility projects for test metrics tracking since it ensures teams triage and fix WCAG compliance issues in a reasonable timeframe.